Today VTC Academy would like to introduce to you how to professionally design Infographic with 8 free tools listed below.
We chose top-ranking free tools and applications to help you create statistical tables. Some options here are even suitable for non-designers because there is a variety of samples and full of features that make them easy to use.
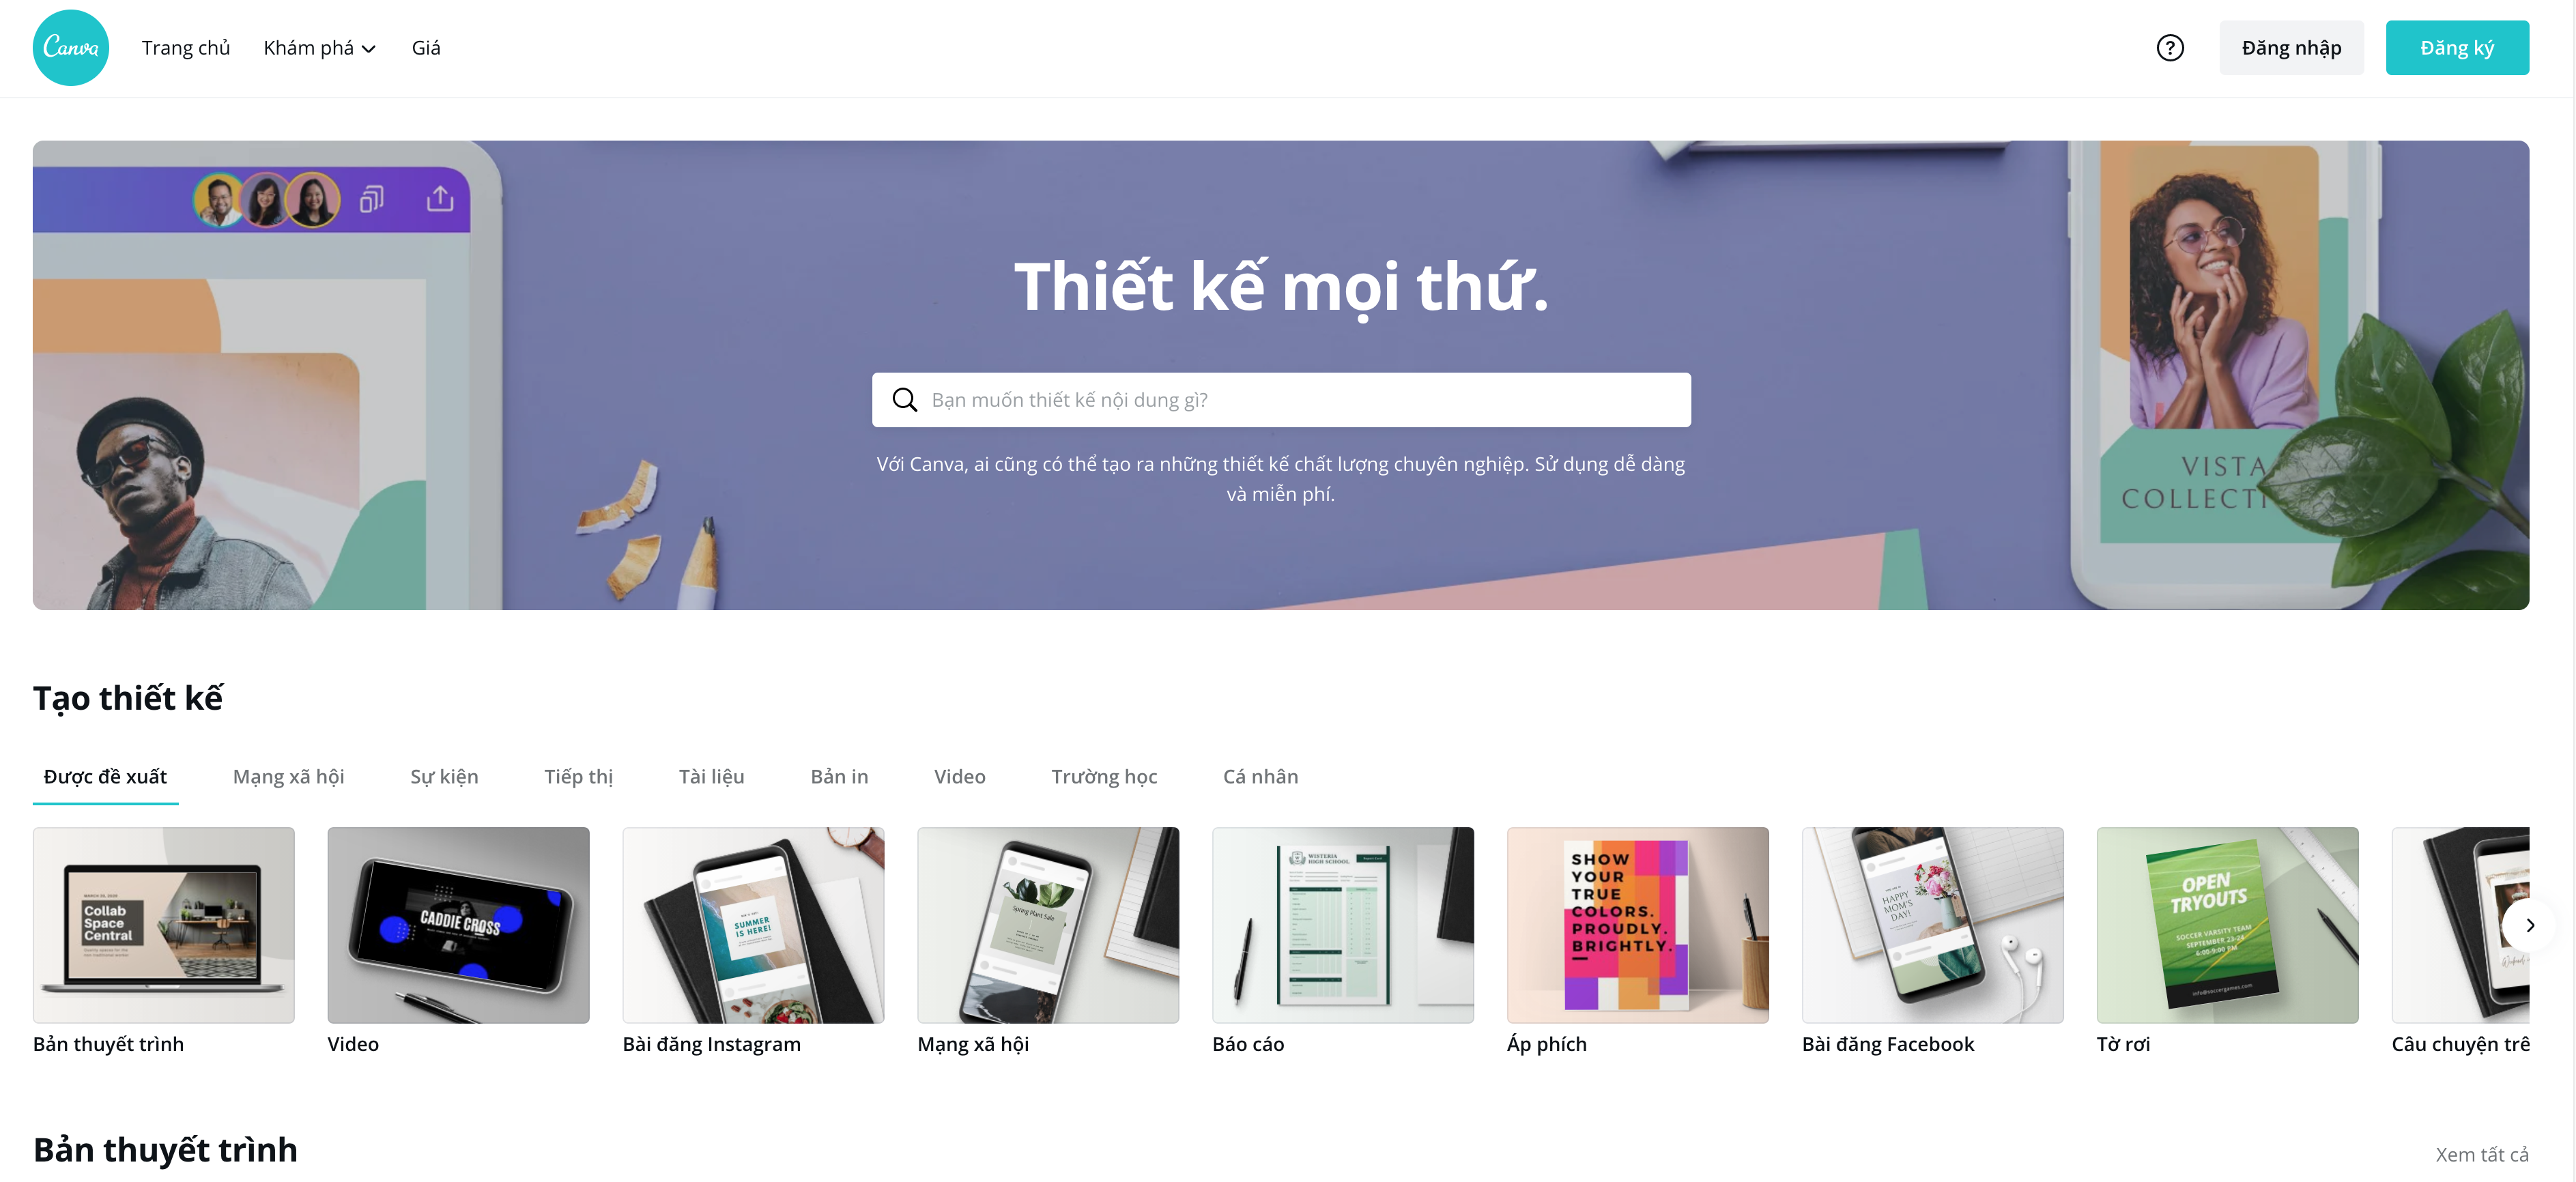
Canva is a powerful and user-friendly online tool for all kinds of design work such as advertisements, presentations and other features. It includes a library of pictures, symbols, fonts and various features to choose.
It has a special feature that is free to use with hundreds of free design models and fonts and many other advanced options that you can purchase at $1. You can use it in browsers or download Canva application in iPad for convenient use.
2. Vizualize

Google chart tool is powerful, easy to use and free. You can choose from a wide range of charts and figures which are totally suitable to your web. By connecting your data in real time, Google Charts is a perfect tool to create infographic for your website.
4. Easel.ly
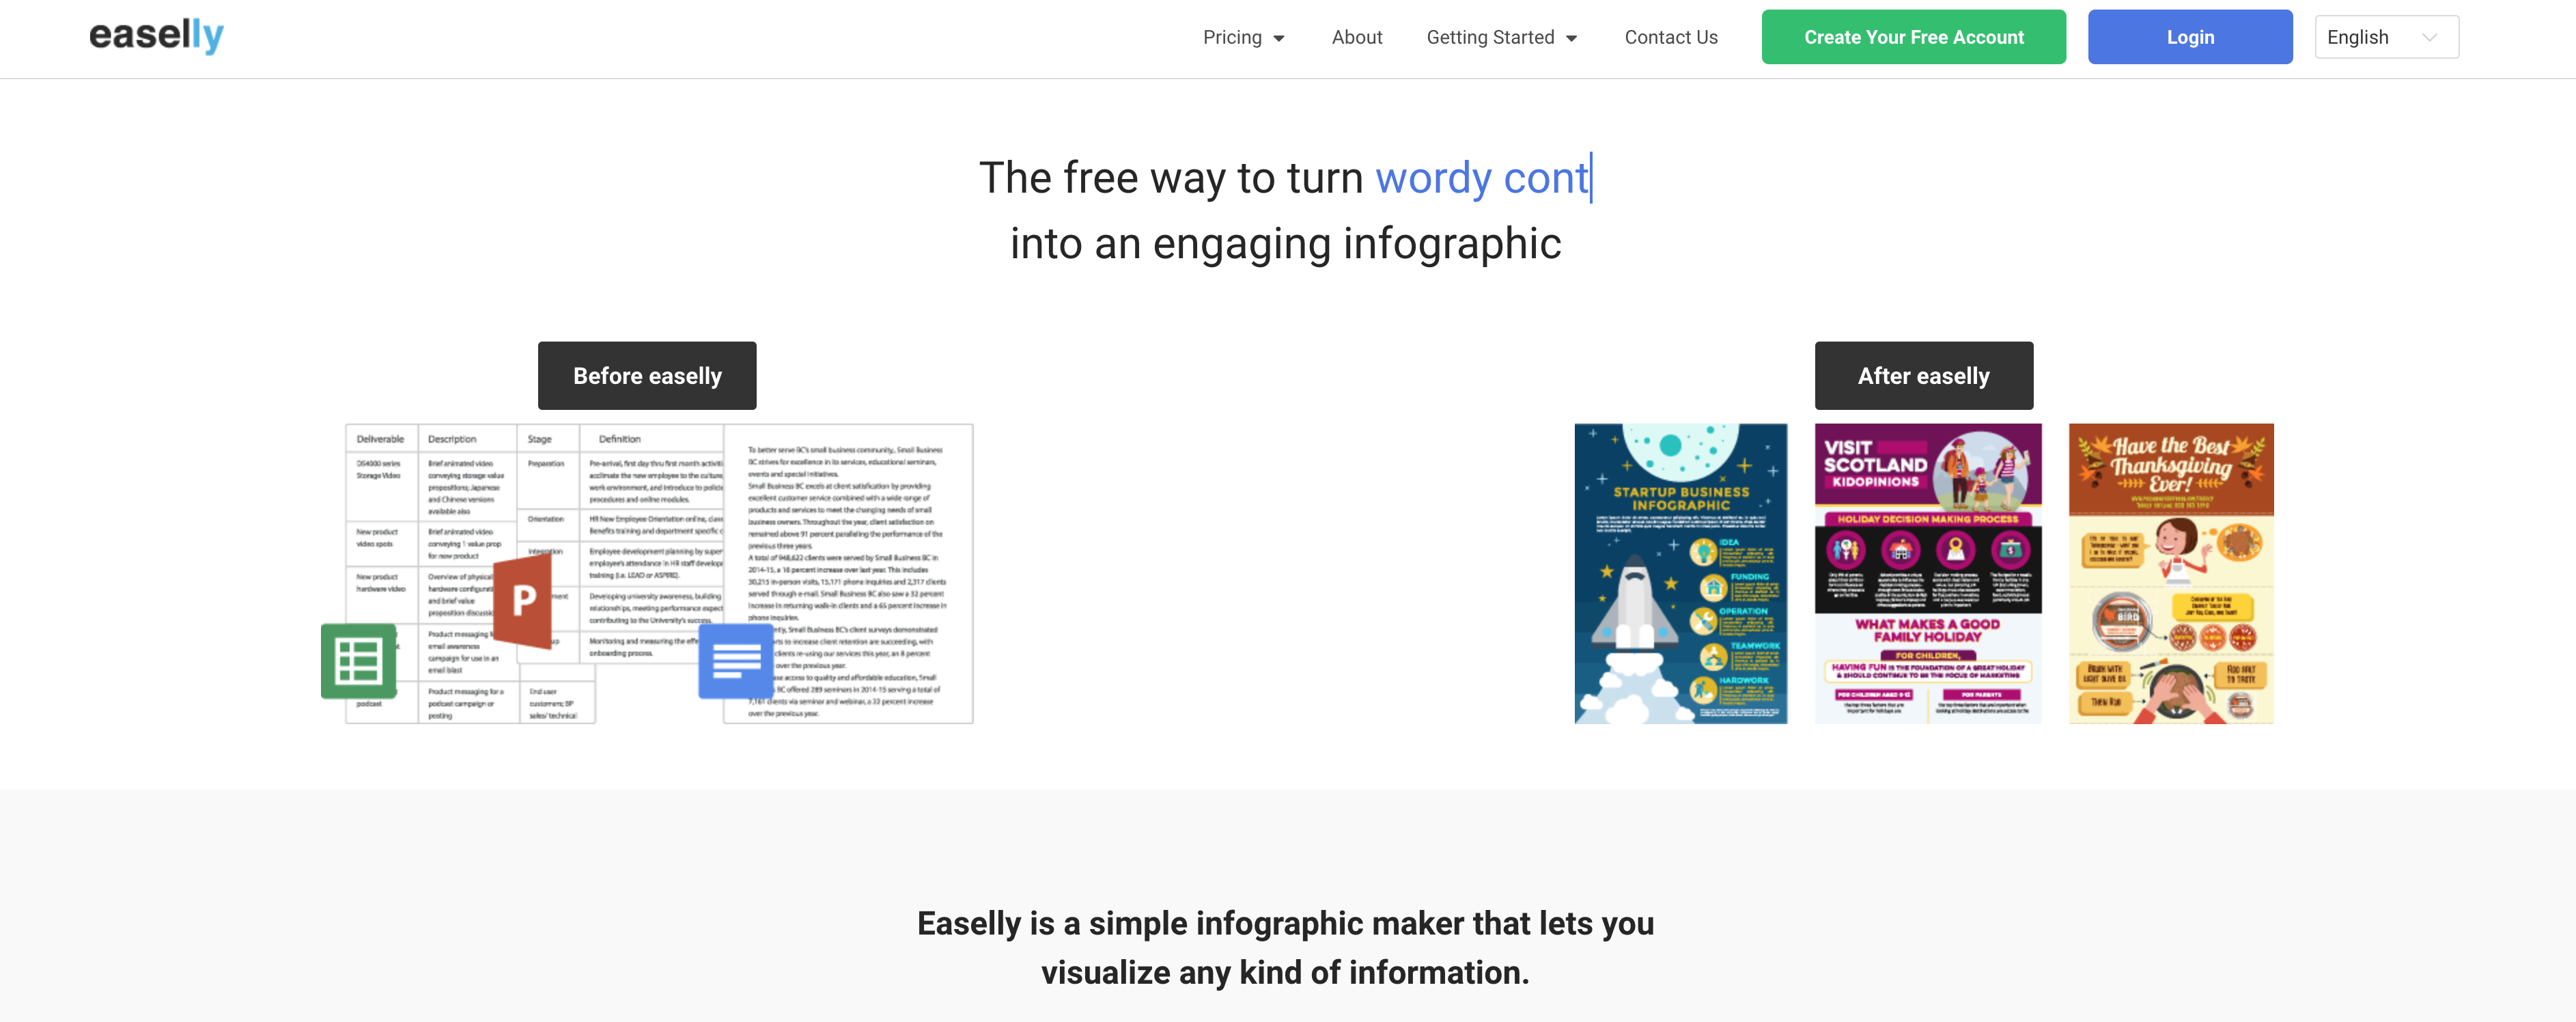
This free tool is based on web infographic and provides you with dozens of free samples to start. It is especially easy to adjust. You can get access to a library of things such as arrows, shapes and lines and you can adjust your document with a series of founts, colors, styles and sizes. This tool also enables you to upload your pictures, personal information and locate their positions by a click.
5. Piktochart
Piktochart is a tool that enables you to change boring data into detailed information charts just by some clicks. Piktochart’s optional edit browser enables you to do such things as changing colors and fonts, inserting uploaded graphics, uploading basic shapes and changing the pictures to the required scale. There is a free version which provides 3 basic themes, 1 pricing plan with 15 dollars per month or a professional account with 29 dollars per month.
6. Infogram
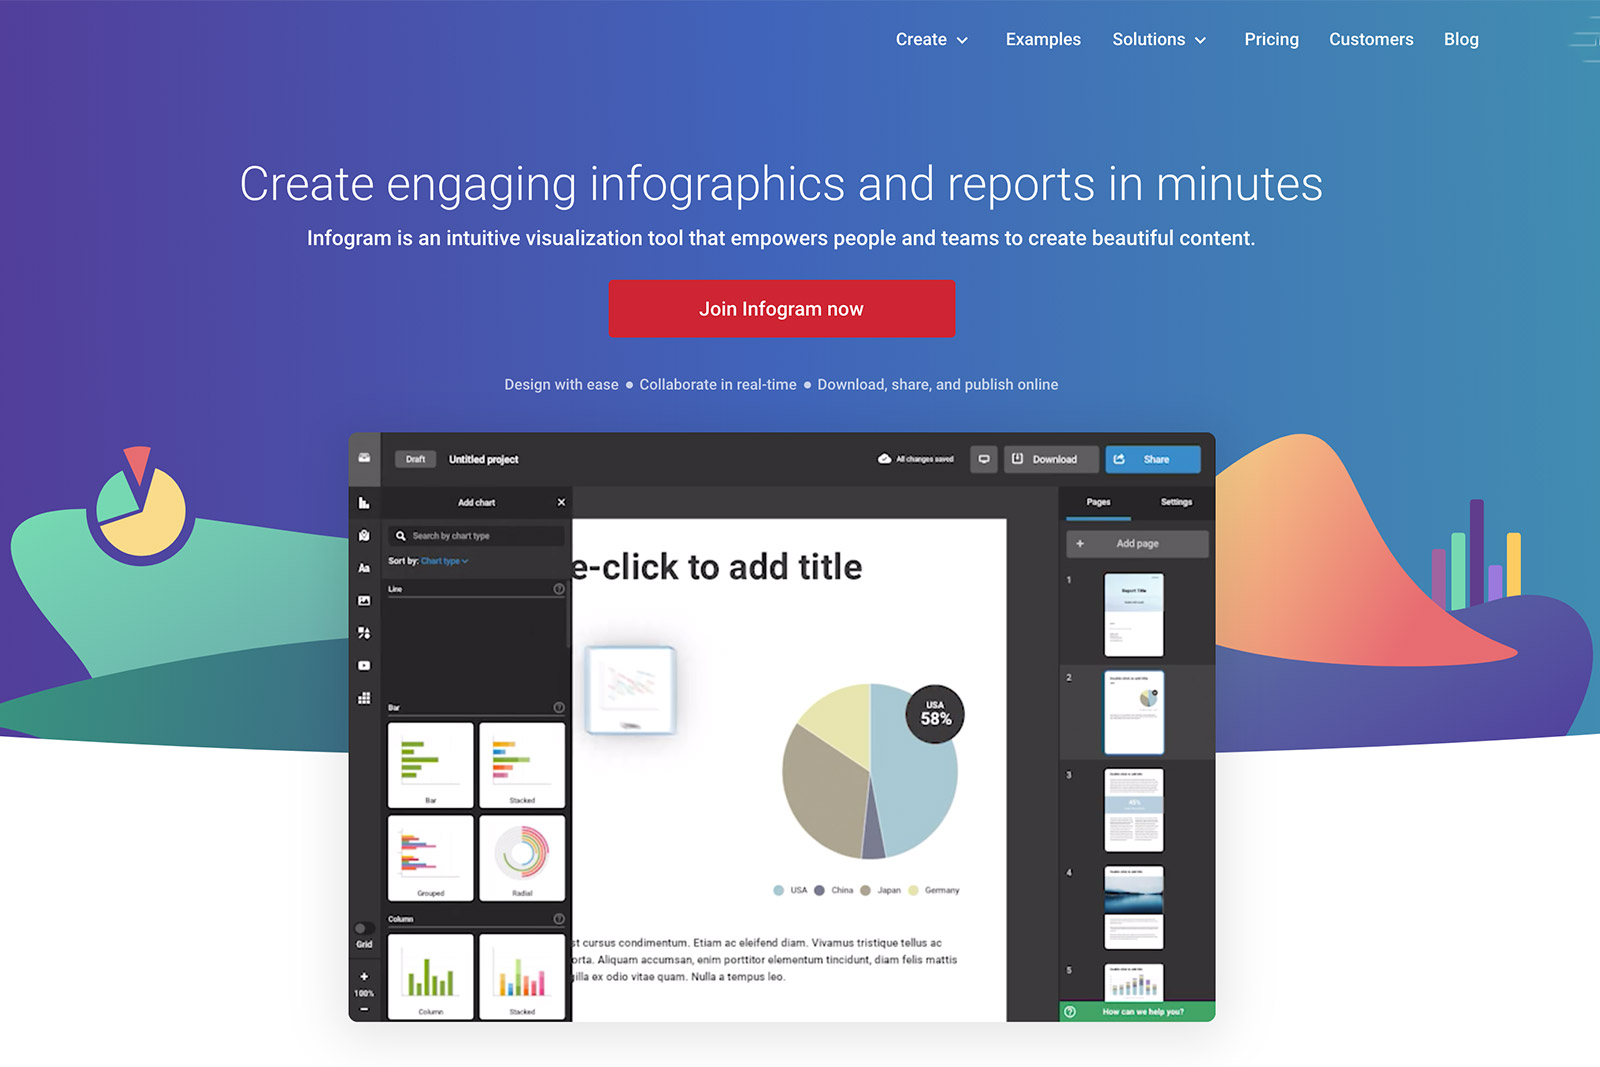
Infogram is wonderful free tool with a lot of graphs, charts and maps as well as the ability to upload pictures and videos in order to create your own creative information symbols. The adjustment is performed in an excel sheet and you can do it easily. The software can automatically change the interface of the infographic to perfectly show the data. Once you are satisfied with the infographic, you can export it to the infographic website so that everyone can enjoy and even embed it into their private website or share it on the social network.
Photo Infographic Gen Lite uses EXIF data attached to your picture, from which it creates eye-catching graphic symbols. It has a great interface and the paid version (with no pop-up ads) is $ 0,99 / £ 0,64, However at present it is only available on Android platform.
8. Venngage

Venngage is a great tool to create and export infographic because it is simple and easy to use. You can choose samples, themes and hundreds of graphs and symbols as well as upload your picture and background or adjust a theme that can suit your brand.
Let’s start your career by taking part in the basic and advanced graphic design course at VTC Academy, the place where every of your dream can come true.


